
Our Products
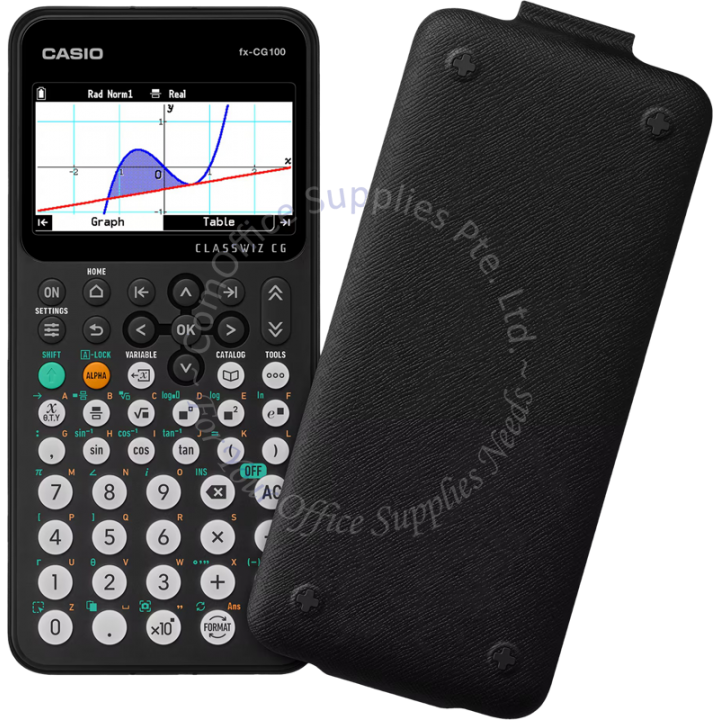

CASIO GRAPHING CALCULATOR FX-CG100
- $428.99
- Ex Tax: $393.57
Graphing calculator with an innovative color display, 3D Graph and Python.
- Easy and Intuitive Operability
Because it features a UI that will be familiar to those who have used the ClassWiz CW Series, this model is easy to use even for first-time users of graphing scientific calculators. - Intuitive cursor operations
In addition to the cursor and OK keys, the calculator features other keys that will be familiar from everyday tasks, such as the Home and Backspace keys. - Key shape designed for accurate entry
The convex and rounded key design makes it easy to press any key from any angle. - VARIABLE key
Variables can be displayed and set instantly. - CATALOG key
Select the main commands from a list. - TOOLS key
Select the main tools from a list. - Tab-style window transitions and pop-up windows
Operations are smooth when users use the Tab key to transition the display in a way that makes sense for learning. - Reduced abbreviations
More abbreviations replaced with full terms for better understanding. - Natural Textbook Display
List display function for thorough, speedy learning - Easy-to-operate, high-definition 3D Graph
Four types of 3D graphs - Sphere, Cylinder, Plane and Line - are available. - Draw and display up to three 3D graphs
3D graphs can be drawn in various ways.
Recognize combinations of graphs and interactive relationships between two or three graphs mathematically.- Three expressions available
- Cylinder and plane expressions
- Cylinder and plane graphs
- Investigate the relationship between expressions and 3D graphs
- Expression
- 3D graph
Select EXPRESS, VECTOR or POINTS format when inputting expression of 3D graphs.
- Explore 3D graphs mathematically
① Zoom in and zoom out
② Vertical and horizontal rotation
③ Cross section
④ X-axis,Y-axis, Z-axis view - Distribution
This app is capable of processing probability distributions of various types, including binomial distribution, normal distribution, Poisson distribution, and more. The app creates visual graph displays that are easy to understand. - Python Programming
Users can use the calculator to learn the Python programming language. The calculator can use Python programs to generate various graphical displays. - Graph&Table
Easily switch between graphs and tables by using the tab key, making it easier to understand the relationship between graph and table. - Graph Solve
Use the Graph Solve feature to easily solve problems involving intersections, roots, and integration. - Examination Mode
Exam Mode mode allows you to quickly prepare your calculator for exams, restricting access to memory, programs, functions and applications. Can be easily set up from the HOME menu. - Basic Functions
- Angle unit, Angle unit conversion (Deg, Rad, Gra)
- Trigonometric functions, Inverse trigonometric functions
- Hyperbolic functions, Inverse hyperbolic functions
- Exponent functions, Logarithmic functions
- Power functions (square root, cubic root, square, power, radical root)
- Coordinate conversion (Pol, Rec)
- Combination/Permutation (nCr, nPr)
- Factorial, Inverse, Random numbers, Random sampling of an existing list, Fractions
- Logical operations
- Sexagesimal ↔ Decimal conversion
- Matrix calculations
- Vector calculations
- Complex number calculations
- Base-n calculations/conversions
- List data calculations
- Rounding
- Display format
- Conversion
- Engineering symbol calculation
- Engineering notation
- Prime Factorization
- E-CON5 (Data logger)
- Graphing
- 3D Graph
- Rectangular coordinate graphing,Polar coordinate graphing
- Integration graph
- Parametric function graphing, Inequality graphing
- Trace, Zoom (box zoom, zoom in, zoom out, auto zoom)
- Table and Graph
- Sketch (tangent line, normal line, inverse function)
- Solve (root, minimum, maximum, intersection, integration: integral calculation improvement (real-time integral calculation), new integral calculation function (mixed integrals))
- Dynamic graph
- Recursion graph
- Statistics
- List-based one-variable and two-variable statistical analysis
- Statistical regression calculations
- Statistical plot (scatter plot, xyLine, normal probability plot, histogram, box plot)
- Statistical regression graphs (linear, med-med, quadratic, cubic, quartic, logarithmic, exponential, power, sinusoidal, logistic regression)
- Advanced statistical calculations: tests (Z-test, t-test, χ²-test, F-test, ANOVA), intervals (Z-interval, t-interval), distributions
- Pie chart
- Bar graph
Hardware
- Power supply : Four AAA-size alkaline batteries or four nickel-metal hydride batteries
- Approximate battery life (hours) : 140 (AAA-size alkaline batteries), 85 (nickel-metal hydride batteries). Assuming 5 minutes calculation and 55 minutes display per hour
- Dot matrix display : 216 x 384 dots
- Display capacity (characters) : 21 x 8
- Internal operation digits : 15
- Nested parentheses levels : 26
- 2.5mm port
- USB port
Share